Power BI User-Guide
Power BI is the main pillar of analytics/business intelligence within the Microsoft Power Platform suite, alongside Power Apps, Power Automate and Copilot Studio.
Zenity covers Power BI with regard to Visibility, Risk Assessment and Governance in a similar manner and standard as customers are accustomed to.
In this guide we will cover the support specifications and limitations regarding Zenity's coverage.
The Zenity User Guide is the centralized Knowledge Base for securing applications built on Low-Code/No-Code development platforms and provides in-depth details on how these applications expose your organization to more risk.
Visibility via the Inventory
The 1st question that comes to mind for customers when enabling Power BI across the business is how can I view and track all the content being built in my organization? As this information is not available.
Shadow Reports/Dashboards/Datasets/Apps are a thing of the past now as customers can view all of them within the Zenity Inventory.
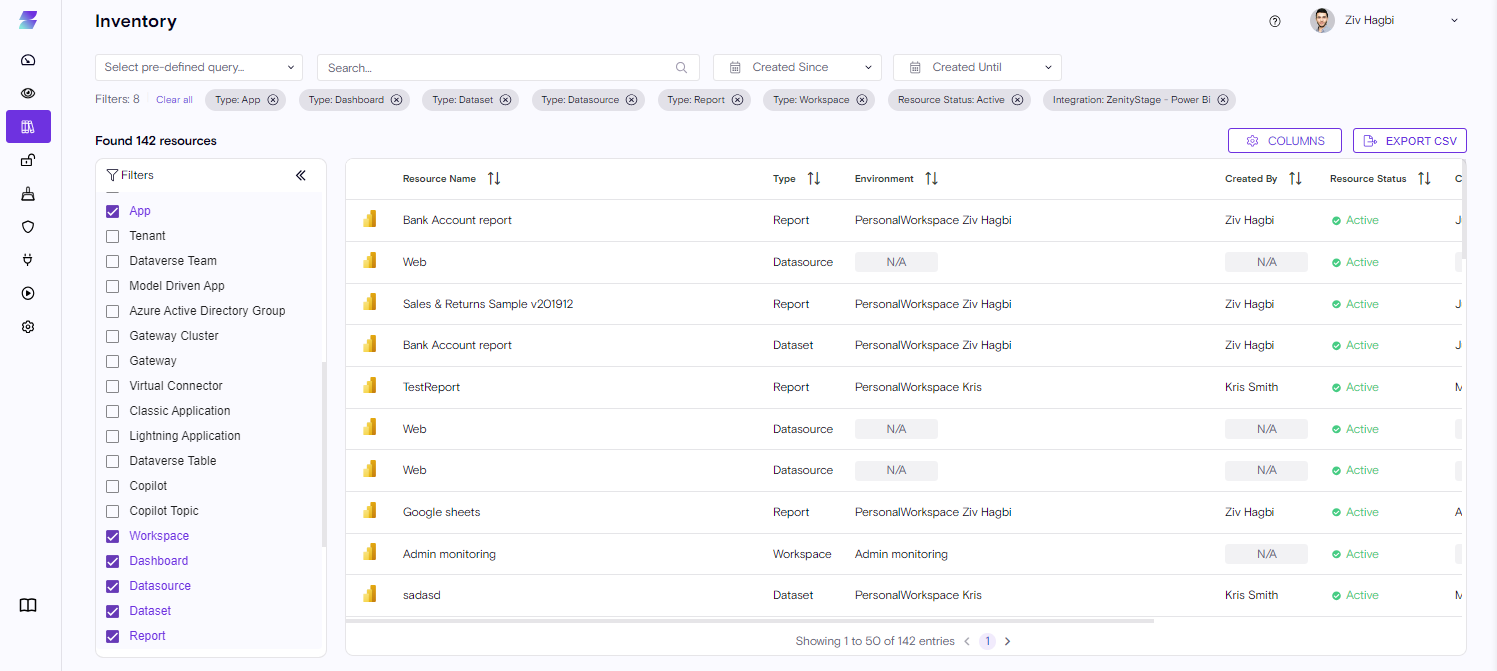
All you have to do is use the 'Resource Type' filter and select either of the above to view all of them.
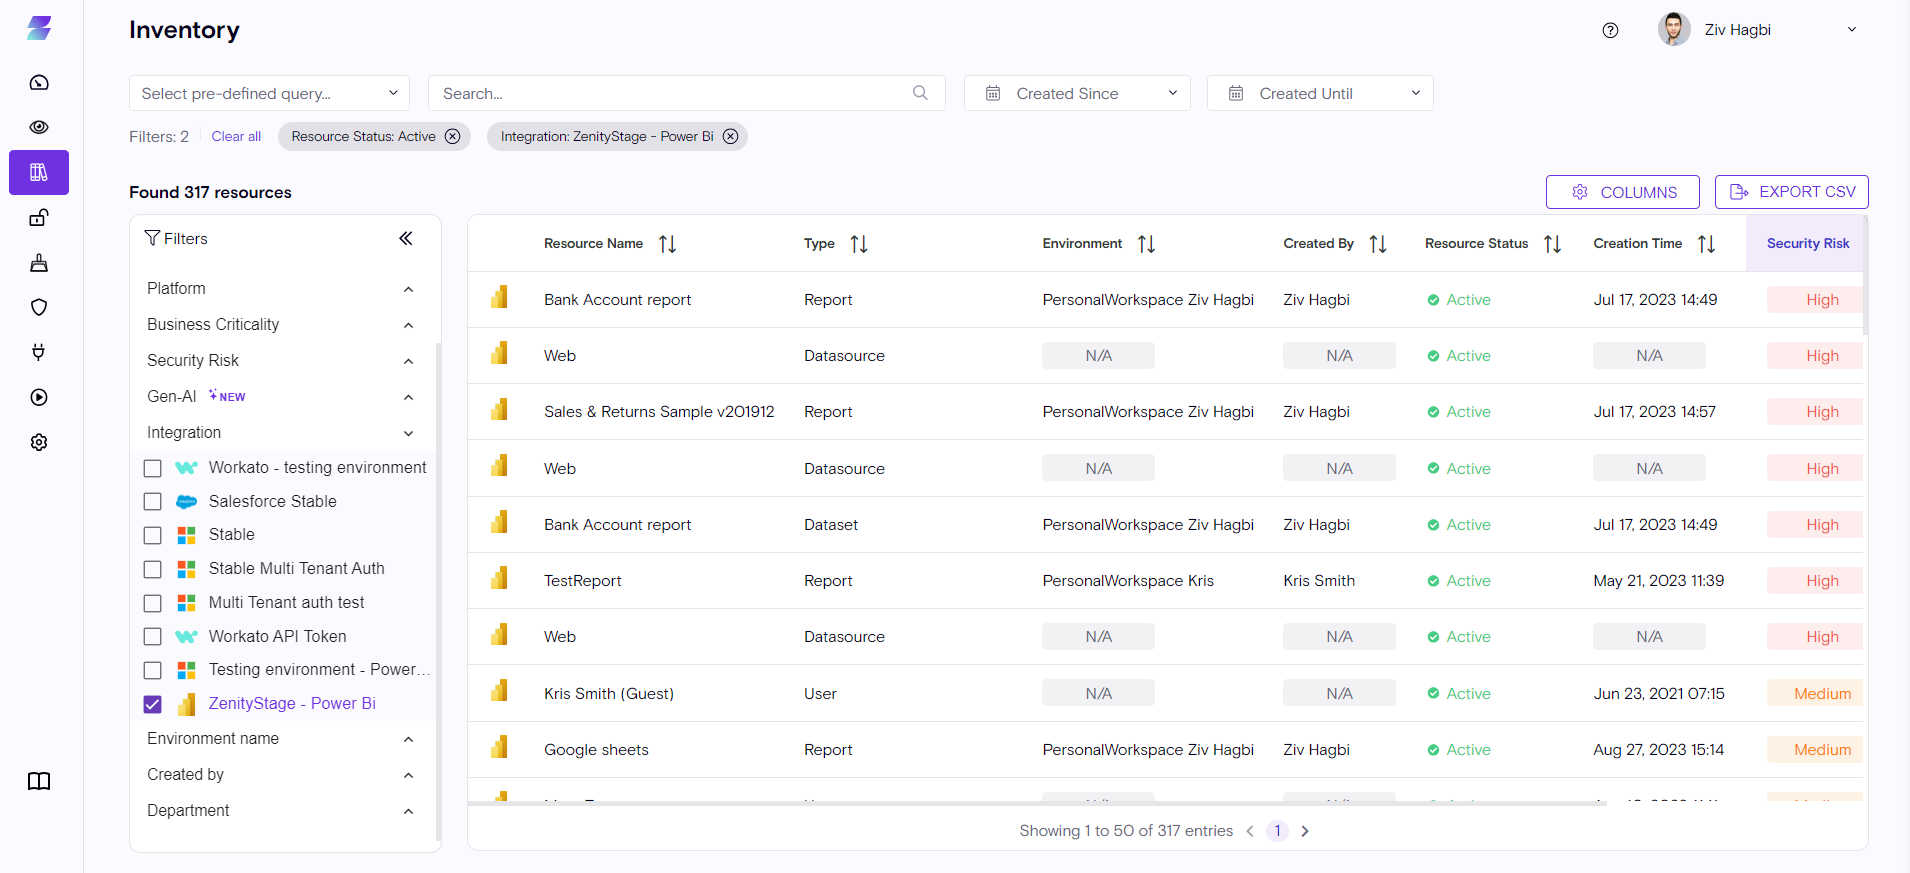
All reports/Dashboards/Apps/Datasets and more will be created will be available including their high-level details, such as the user who created them, time of creation, environment of creation etc...
For example, with a quick glance you can immediately have an accurate number of many Power BI Reports, Dashboards, Apps and Datasets were built thus far.
Zenity allows you to drill down and have a more in-depth look at the Power BI Report (this is also true for any other resource we surface). In case a customers need to learn more about the resource all he has to do is click on the Report itself.
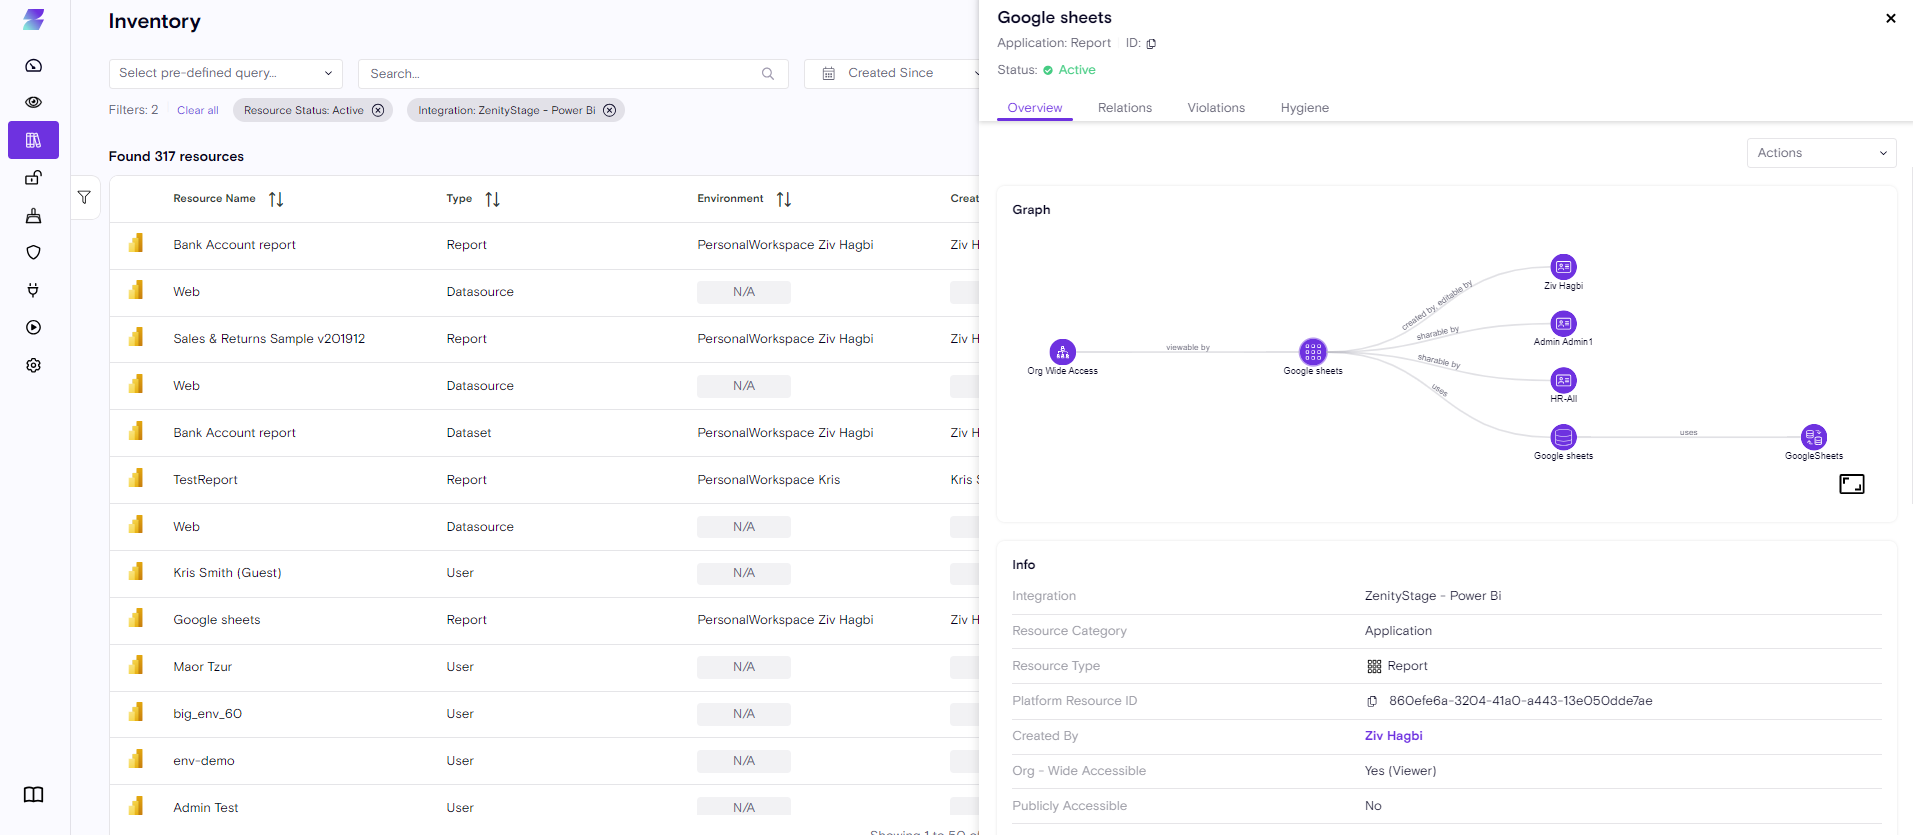
What extra information customers are gaining from this view?
Graph
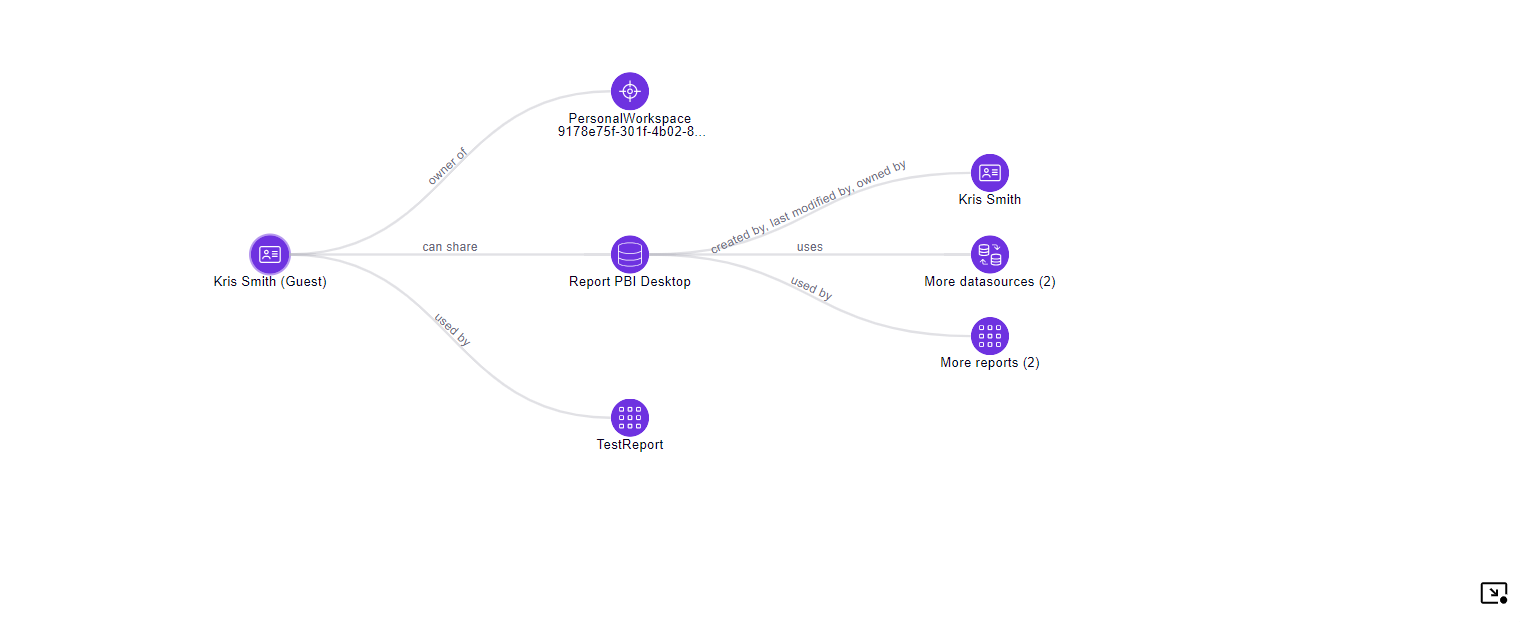
Visual Context via the Zenity Graph
- Through the Zenity Graph customers can see how every resource relates to the Report Itself, for example, what datasets were used to create the report or which users have access to it.
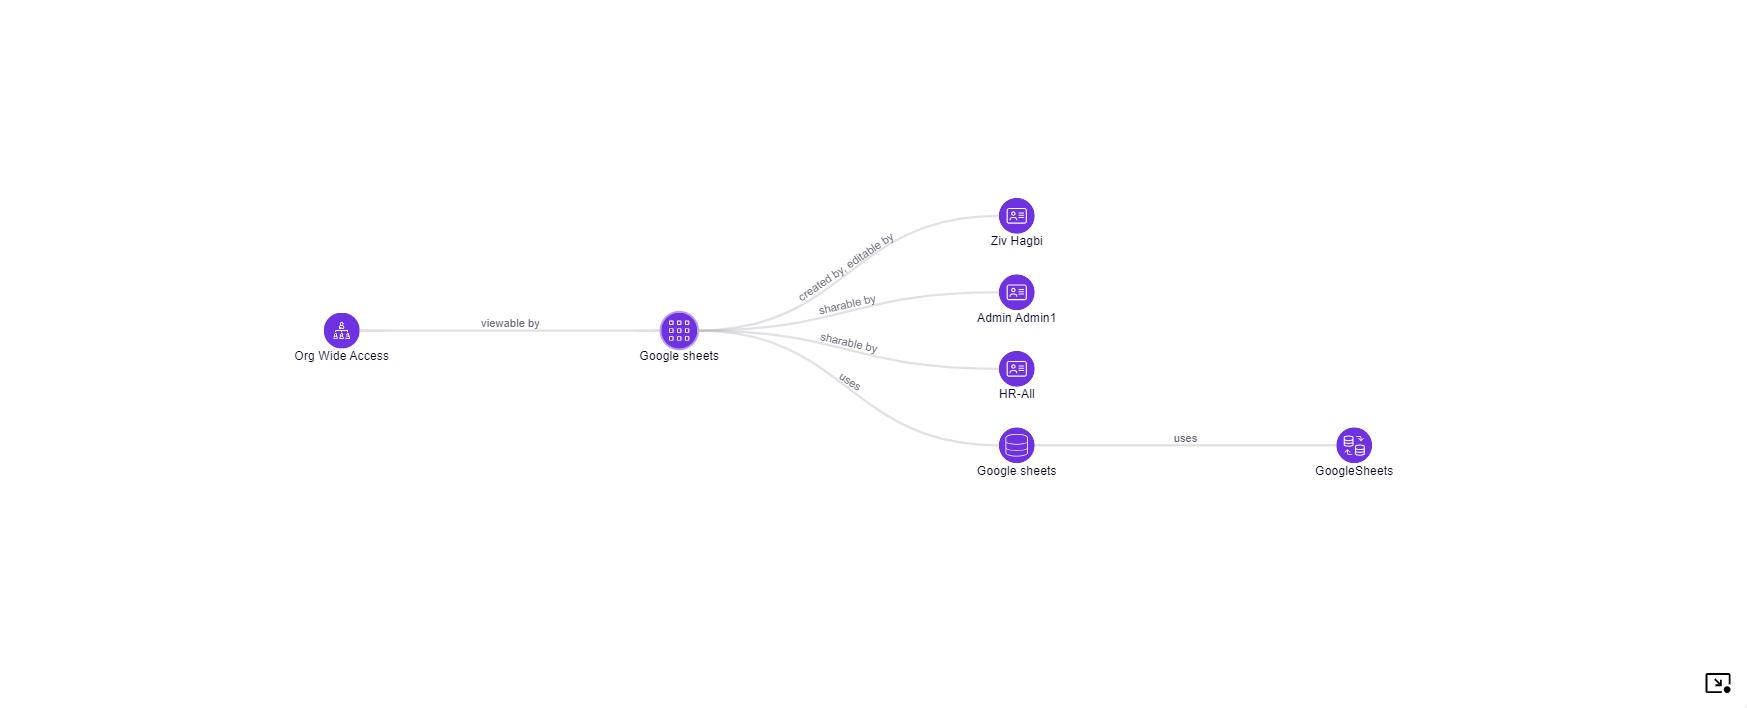
Zenity supports the following resource and resource relations for Power BI, reflected in our Graph.
- Report <-> Dataset/Dashboard/App/Workspace
- Identities <-> Report/Dashboard/Dataset/Workspace
- Including Users, Guests & Groups
- Including Users, Guests & Groups
-
Report <-> Access
-
Org-Wide Access ,allowing anyone in the organization that has the link to view the report (excluding guests).
- Public Access, allowing anyone in the world to view the report.
-
Dataset <-> Datasource
-
Workspace <-> report/Dashboard/Dataset/Identities
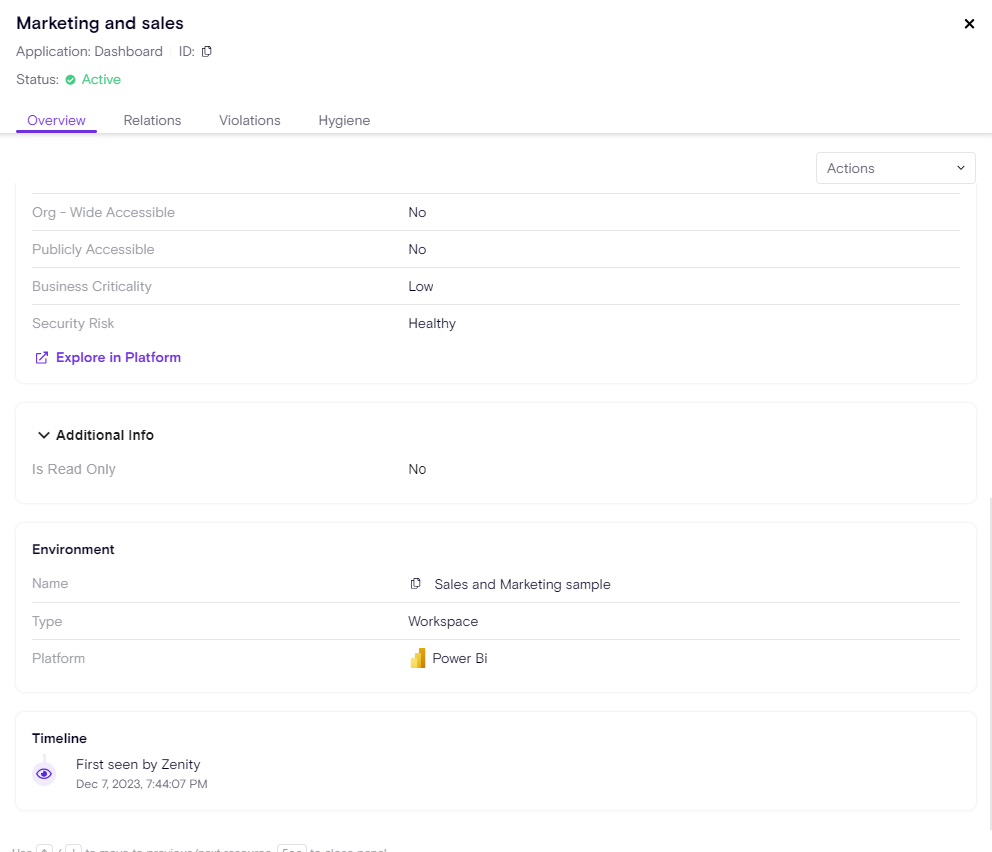
Reports
A Power BI report is a collection of visualizations, charts, tables, and other data representations created using Power BI Desktop or other Power BI tools. It is an interactive document that allows users to explore and analyze data by interacting with the visuals. Reports are typically created by data analysts or report developers and provide a detailed view of the data.
Info
The Info section of the resource side-panel will provide high-level metadata about Power BI Resources.
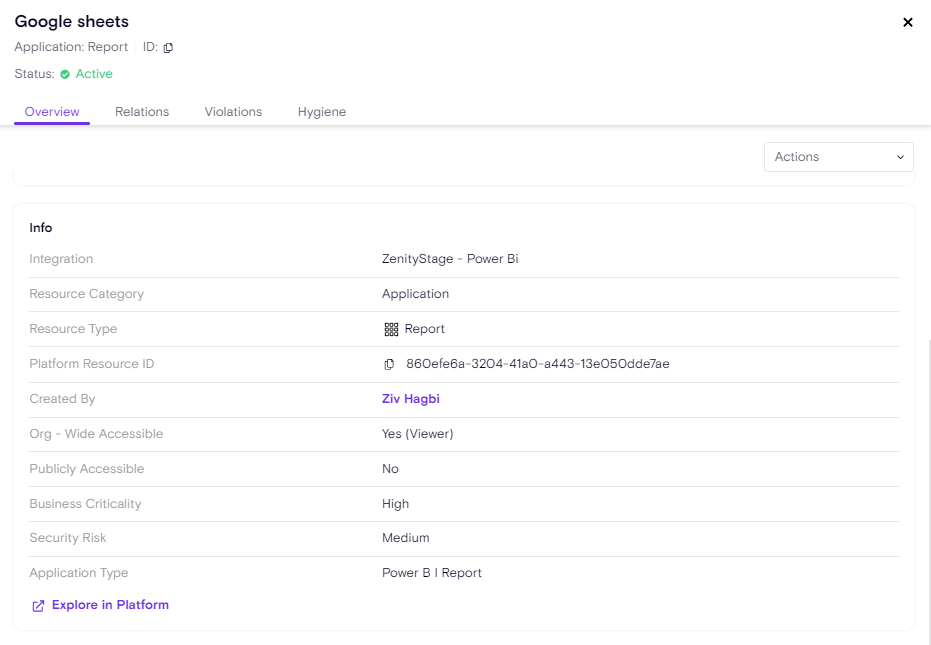
Most of the above are generic for all resources but for Power BI Reports we added the below as well:
Org - Wide Accessible
Applicable values are "Yes (Viewer)" or "No".
-
"Yes (Viewer)" means Anyone with Azure AD authentication can view the report via the sharing link, excluding guests.
-
"No" means it's not shared with the entire organization.
Publicly Accessible
Applicable values are "Yes" or "No".
-
"Yes" means Anyone in the world can view the report and explore the data, given that he has access to the report direct link.
-
"No" means it's not publicly exposed.
Additional Info
The additional info is a place where we add more custom insights about the resource.

-
Sensitivity Label Name
-
The Microsoft Information Protection label configured for this report (depending on whether MIP is available in your organization).
MIP labels can be configured automatically based on Policy or manually by the end users. Zenity covers all of them.
-
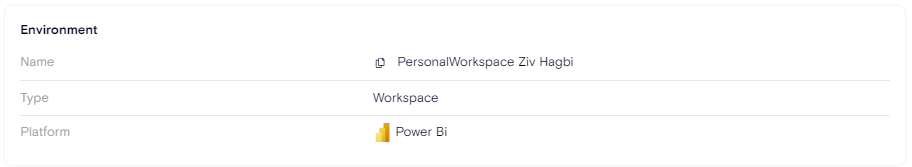
Environment
Environments are a concept in Zenity to describe a logical container of resource.
Similar to Power Apps and Power Automate Zenity can map each Report, Dashboard, App and Dataset to there respective environent to assist with data governance and sovereignty.
In Power BI 'Environments' are called 'Workspaces'.
Meaning, Zenity users can view each workspace and explore what content is included within it.
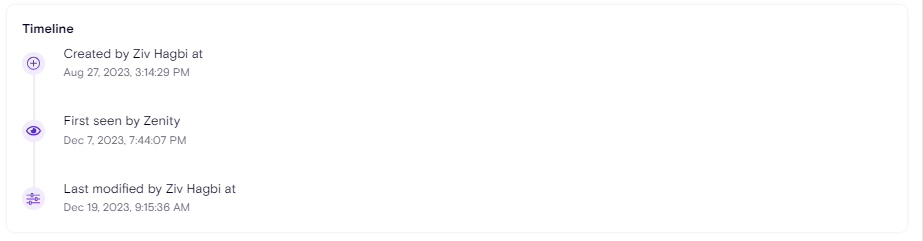
Timeline
Identical to Power Apps and Power Automate Zenity continuously scans the tenant and is able to build a timeline that reflects major changes in the life cycle of Power BI resources such as reports, datasets and others, specifically:
-
Created at and by who
-
Last modified at and by who
-
1st seen by Zenity
- The 1st time a Zenity scan identified the resource
Due to limitation and data gaps in the Power BI API, some data is missing for some resource types. Read the 'Limitation' section at the end of the doc to understand the gaps.
Alongside Power BI Reports Zenity also surface other Power BI related resources,
the main ones are the Dashboard, Apps, Datasets, Workspaces and Datasources.
In the below section we will cover each of them.
Dashboards
A Power BI dashboard is a single-page canvas that combines multiple visuals from one or more reports. Dashboards provide a high-level overview of key metrics and insights, allowing users to monitor and analyze data at a glance. Users can pin visualizations (tiles) from different reports to a dashboard, and these visuals remain live and connected to the underlying data.
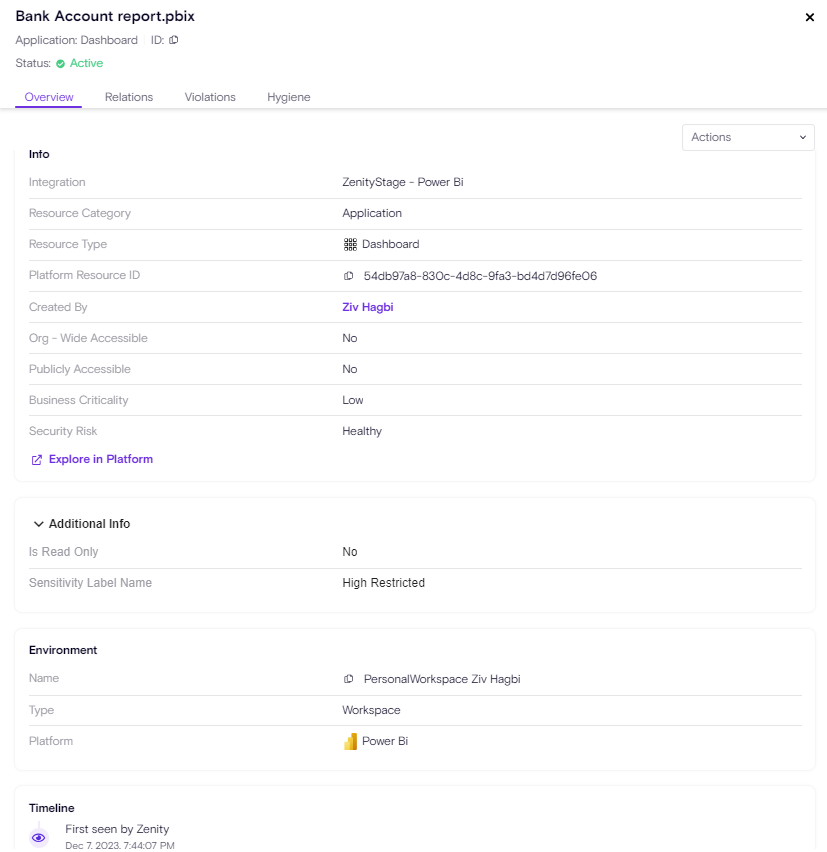
Most of the above are generic for all resources but for Power BI Dashboards we added the below as well:
Additional Information
Is Read Only - Whether the dashboard is read-only
Sensitivity Label Name - The Microsoft Information Protection label configured for this report (depending on whether MIP is available in your organization).
App ID - In case the Dashboard is bundled within an App, Zenity will surface the specific app.
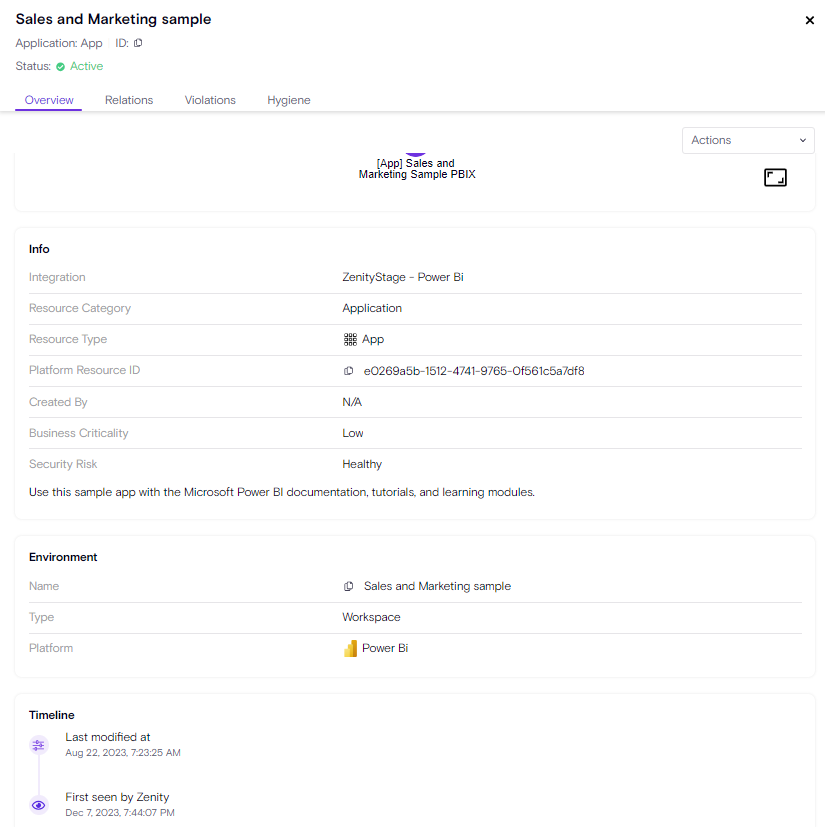
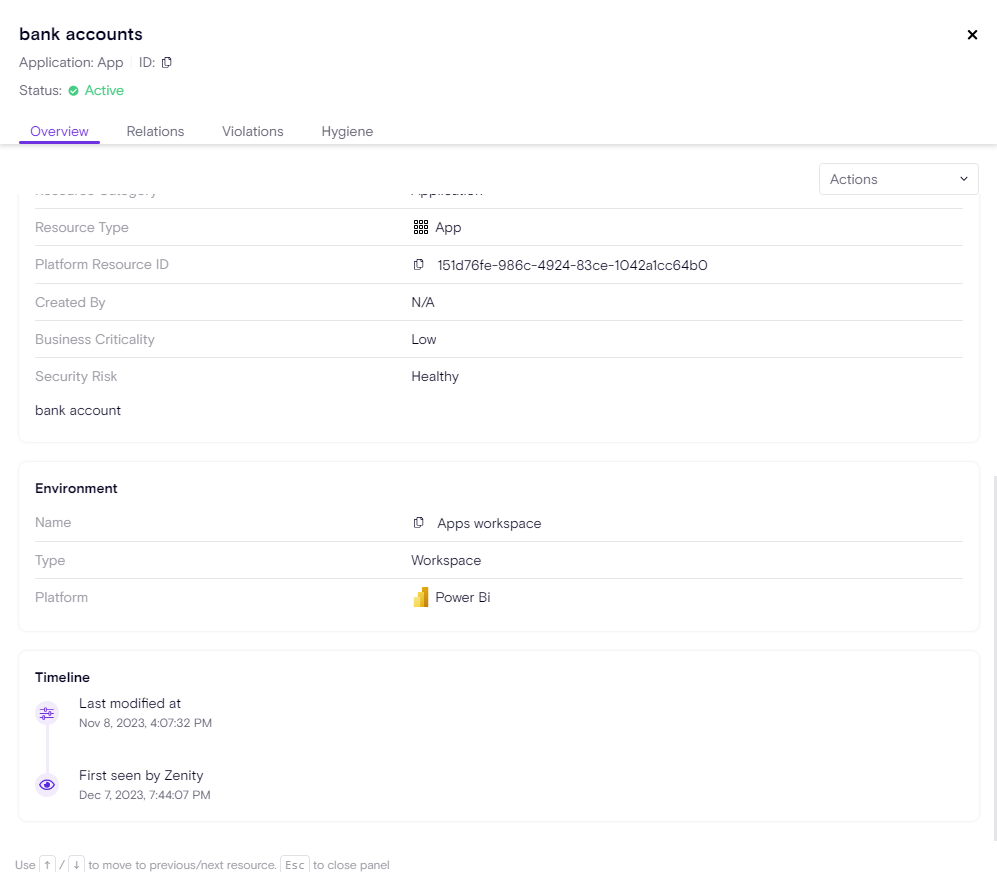
Apps
A Power BI app is a package that combines related dashboards, reports, and datasets into a single, shareable unit. Apps are used for distributing and sharing content with others within or outside the organization. When you share an app with someone, they get access to the dashboards and reports contained in the app. Apps help in delivering a consistent and curated experience for consumers of Power BI content.
Datasets
A Power BI dataset is a structured collection of data that serves as the foundation for creating visualizations, reports, and dashboards. It includes data imported or connected from various sources, undergoes data transformation and modelling, and can be refreshed to reflect the latest data. Datasets support relationships between tables, the creation of measures and calculated columns, and can be shared and reused across reports and dashboards within the Power BI service.
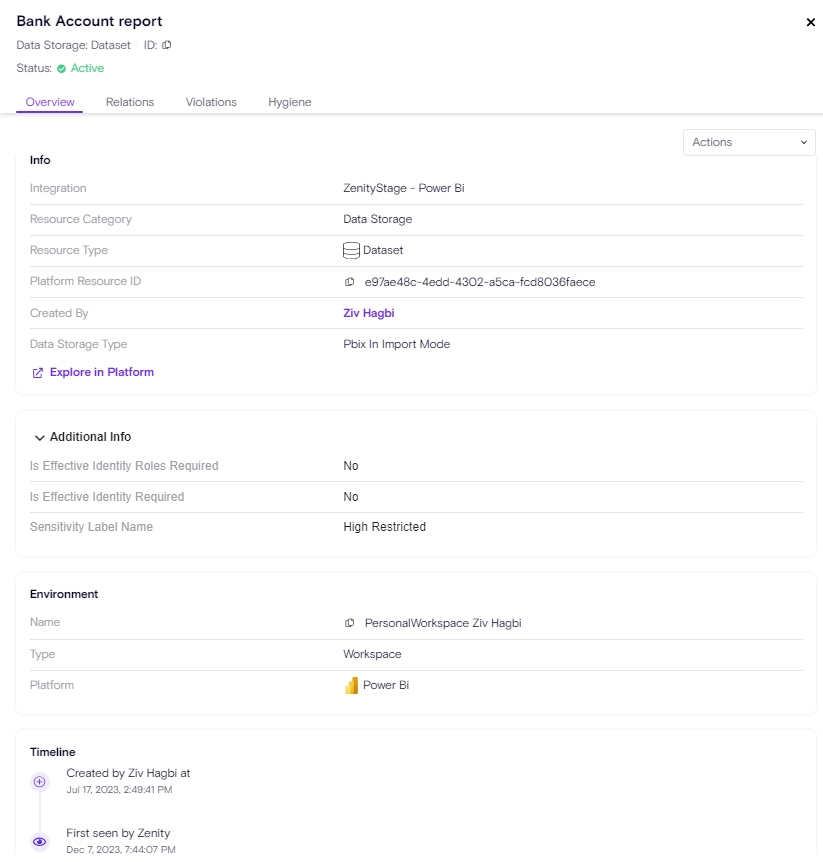
Is Effective Identity Roles Required - Whether the dataset requires an effective identity.
Is Effective Identity Required - Whether row-level security is defined inside the Power BI .pbix file. If so, you must specify a role.
Sensitivity Label Name - The Microsoft Information Protection label configured for this Dataset (depending on whether MIP is available in your organization).
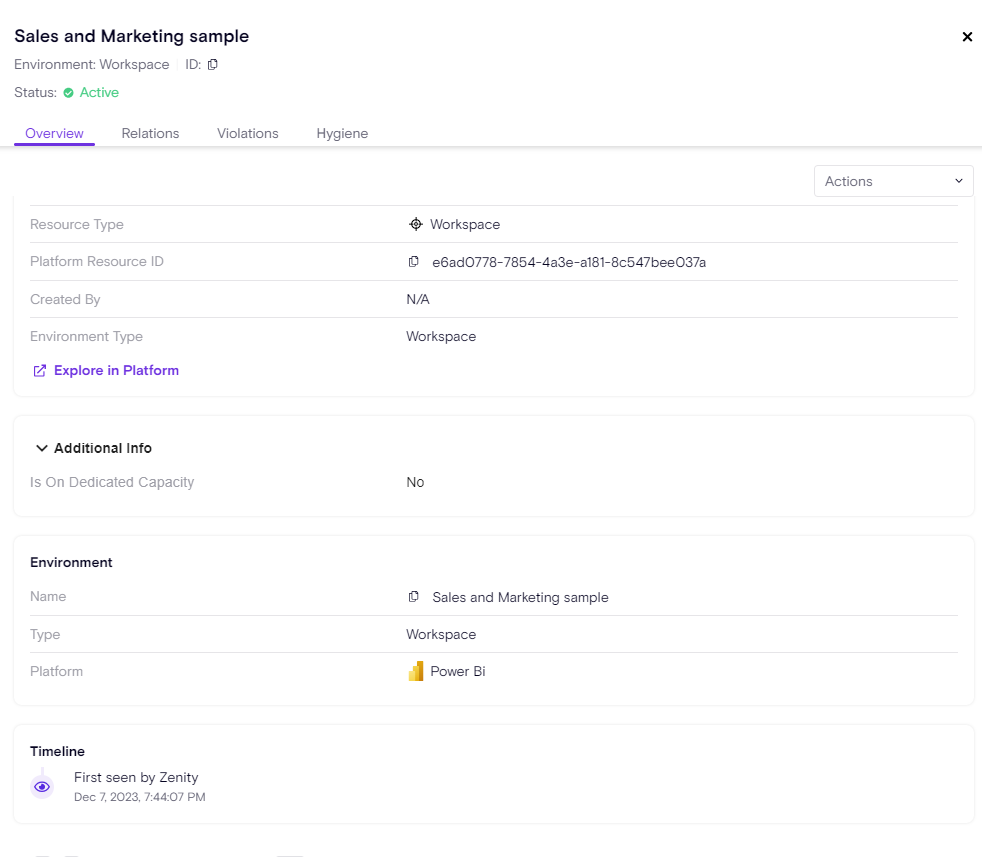
Workspaces
A Power BI workspace, is a shared area where users collaborate on reports, dashboards, and datasets. It allows for organized content, access control, and collaborative editing. Workspaces are used for deploying and distributing Power BI apps and exist both in Power BI Desktop and the Power BI service. There are personal workspaces and also shared workspaces.
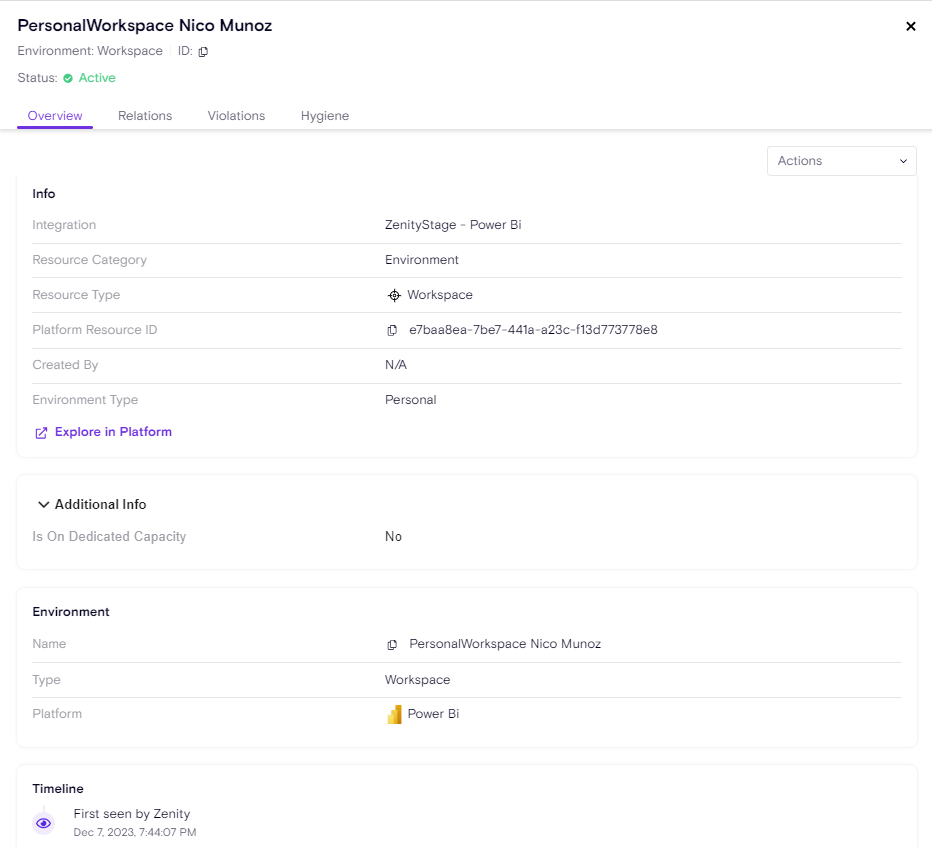
Info
- Environment Type Indicates whether the Workspace is a personal one 'My Workspace' or a shared workspace were users can share content.
Additional Info
- Is On Dedicated Capacity Indicates whether the Workspace is onboarded on a dedicated capacity. Dedicated capacities
Datasources
A Power BI Datasource is where your data comes from, such as an Excel file, database, or online service. It serves as the origin of information for creating datasets, reports, and dashboards. Data sources can be connected or imported, and Power BI provides various integrations for different types of data.
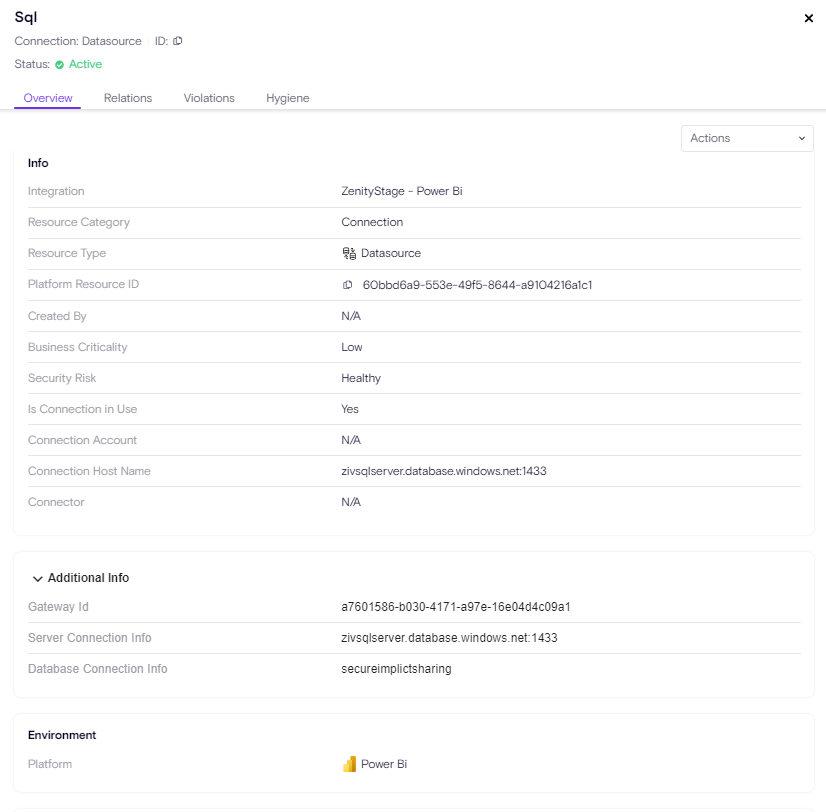
Additional Info
-
Gateway ID The ID of the gateway configured to work with the respective datasource
-
Path Connection Info The specific route of the file used in the datasource, for example an excel file in a local drive.
-
URL Connection Info The URL used in the datasource
-
Extension Source Connection Info The specific SaaS integration used in the datasource, for example, Google Sheets.
All of which are covered by Zenity.
Risk Assessment
Zenity covers a wide range of security use-cases for Power BI,
including:
-
Guest Access
-
Suspicious Endpoints Communication
-
Privileged Role Abuse
-
Sensitive Information Exposure (MIP Labels)
-
Organization Wide Access
-
Authentication Issues / Anonymous Access
-
Resource Oversharing
-
Data Leakage
All of the above are covered in different violation rules across Zenity, the rule list for Power BI keeps updating and more rules are added.
Risk Scenarios
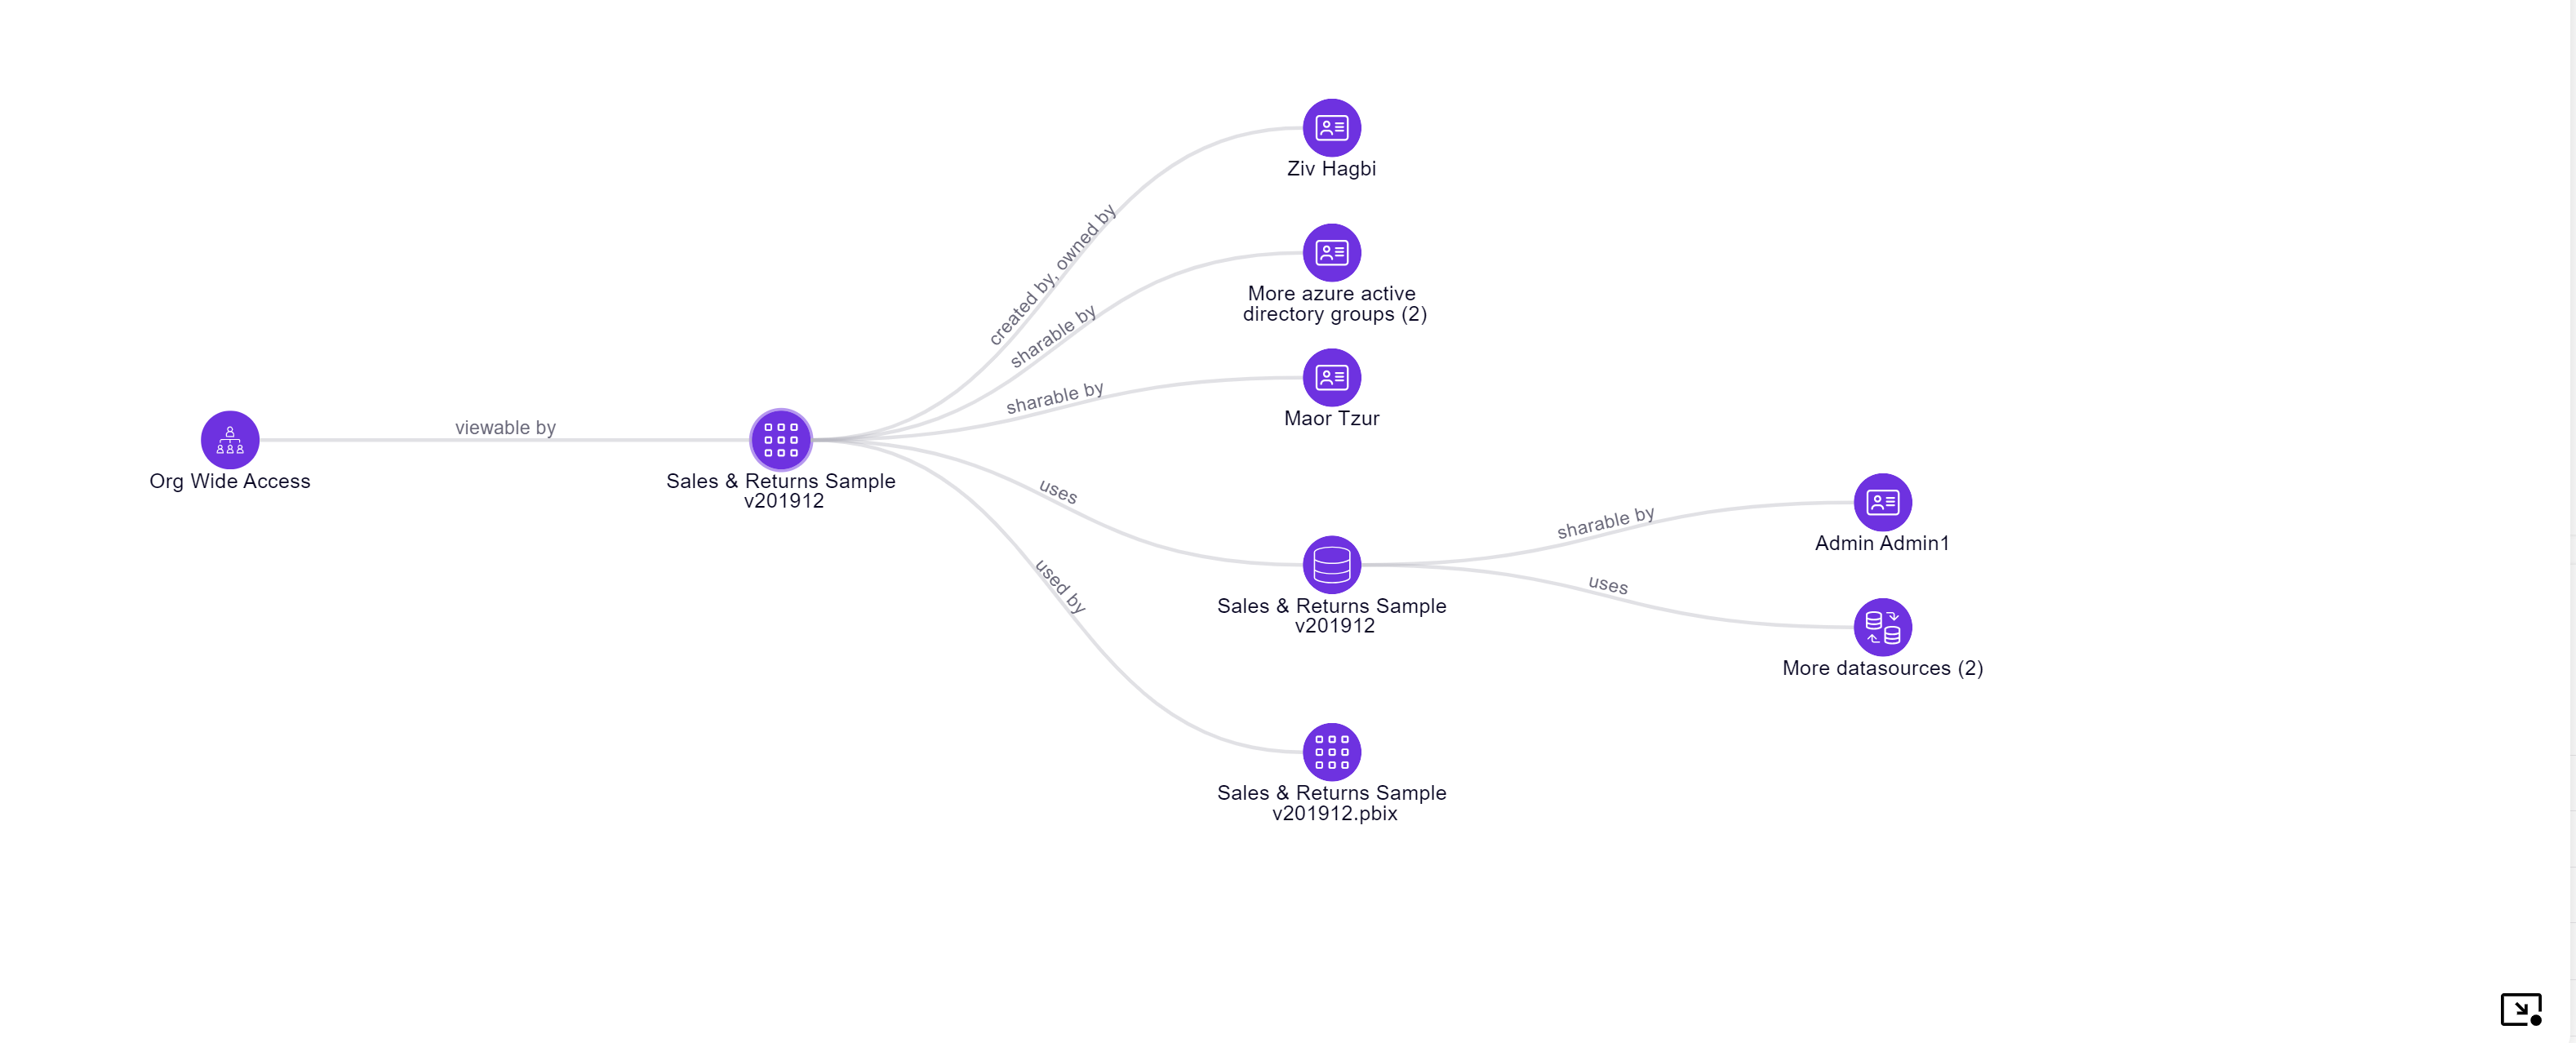
1. Power BI report is accessible by the entire organization exposes corporate data
In this scenario, the Power BI report is accessible by the entire organization and on the other hand connected to a SQL Server via a shared SQL Connection. The Graph shows the e2e path to exploit and data that is exposed.
This graph shows that any member within the organization that has the report link, can view the report.
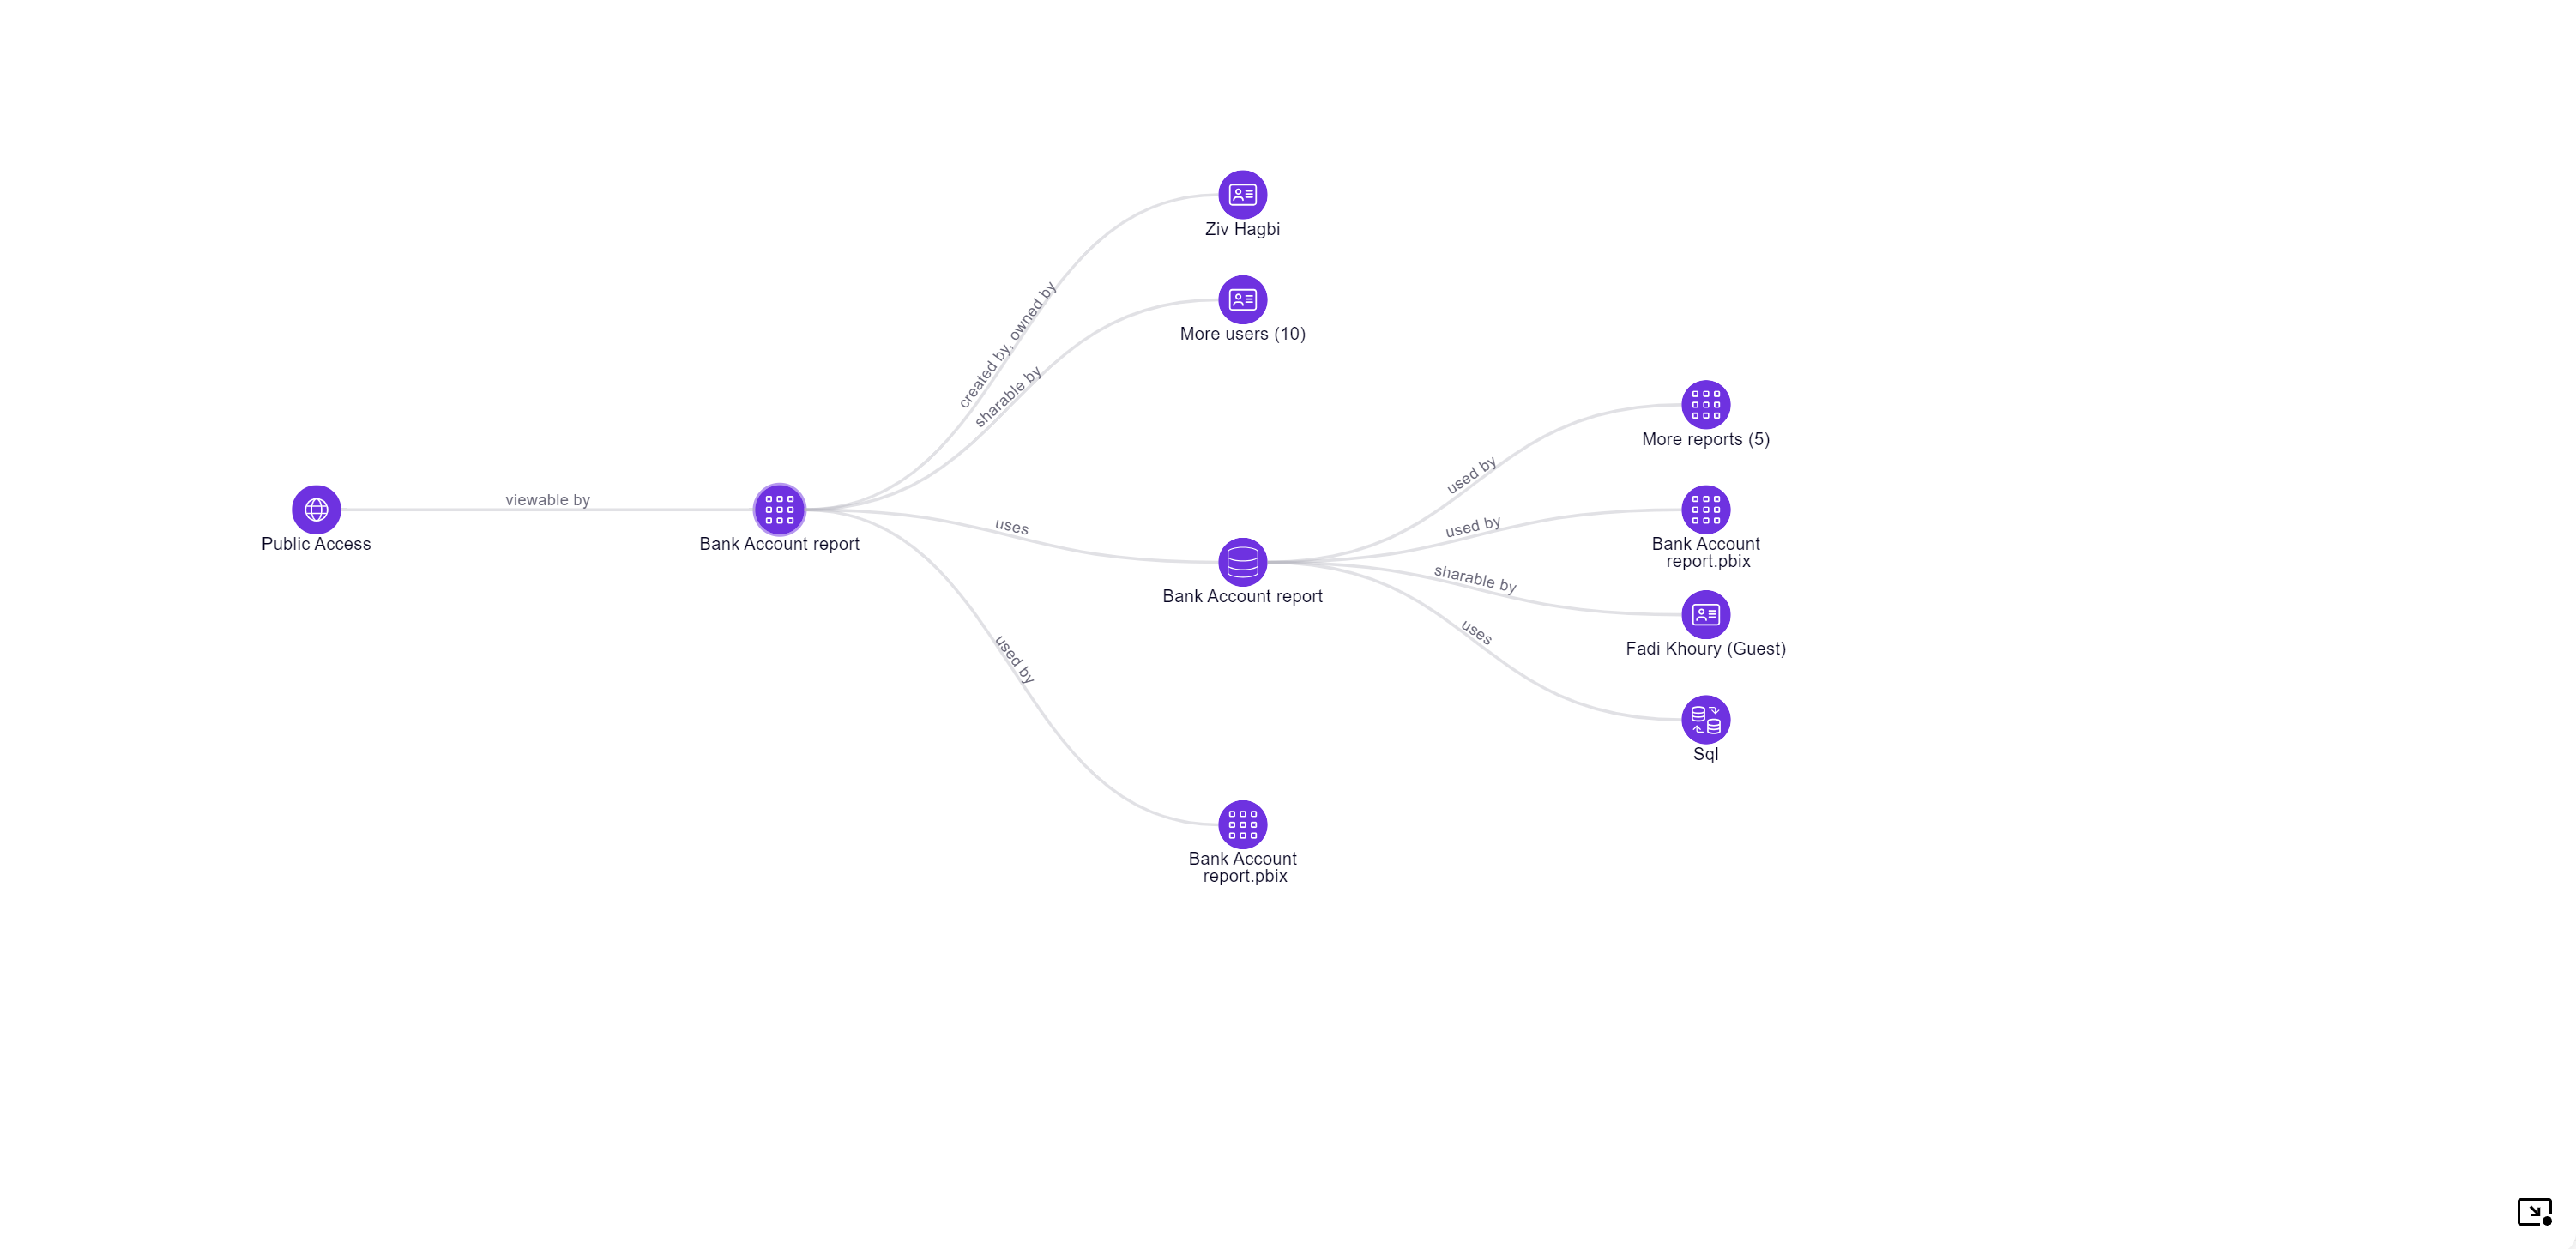
2. Power BI report without authentication exposes business data
In this scenario, the Power BI report is accessible by anyone (no authentication required) and on the other hand connected to business data. The Graph shows the e2e path to exploit and data that is exposed.
This graph shows that any user with access to the report link (potentially anyone) can view the report and extract data.
3. Power BI Report communicating with a suspicious HTTP endpoint
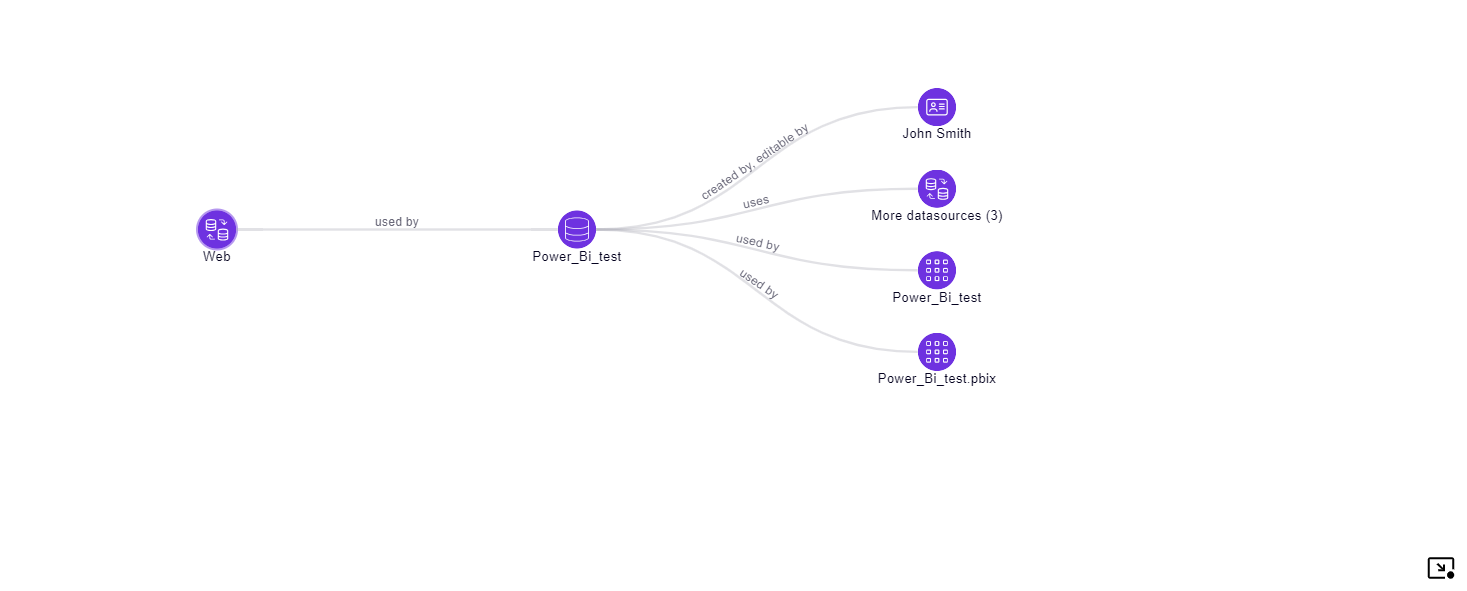
In this scenario, the Power BI report was created using a dataset which used a Web datasource getting data from untrusted source. Power BI connects to an external web server via the Web datasource.
In addition, in case the HTTP URL is not within the 'Endpoint Filtering' allowed list, Zenity will flag this scenario and the violation will show the specific URL used.
4. Power BI Dataset handling corporate data exposed to Guest users
In this scenario, the Power BI Dataset is accessible by the entire organization (meaning every user in the org that has the report link can view its content) but in addition it is also shared with a guest user with privileged access. The guest user not only has access to the report but it also has access to the underlying dataset. For example, if Power BI report or dataset expose sensitive data the guest user will have access to both.
The Graph shows the e2e path to exploit and data that is exposed.
Limitations & Considerations
The Power BI Admin API has several gaps customers need to be aware of when using Zenity.
Resource Timeline
- Not all resources in Zenity have full timelines, as it's not available through the Power BI API.
Here are the gaps.
Dashboards are missing
- Created at
- Created by
Available for stand-alone dashboards
Missing for dashboards embedded in Apps.
- Last modified at
Workspaces are missing
- Created at
- Created by
- Last modified at
Apps are missing
* Created at
* Created by
Inventory
Currently, reports, Dashboard and Apps are classified as separate 'Resource Types' under the 'Application' resource category. This means that in different dashboards they are displayed under the 'Application' group.
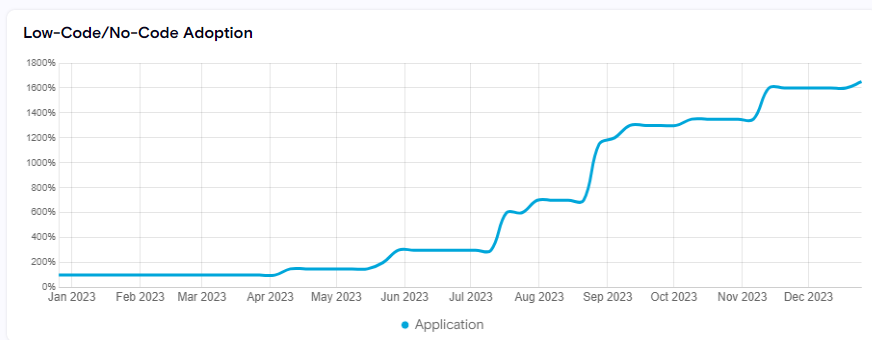
Main Dashboard
The Low-Code/No-Code Adoption widget counts 'Application' but actually takes into consideration Reports (as only them have creation time in Power BI).
Visibility Dashboard
As Reports, Dashboards and Apps are classified under the Application category, they will all be counted under that widget. Workspaces will be counted under 'Environments' and 'Datasources' will be counted under 'Connections'.

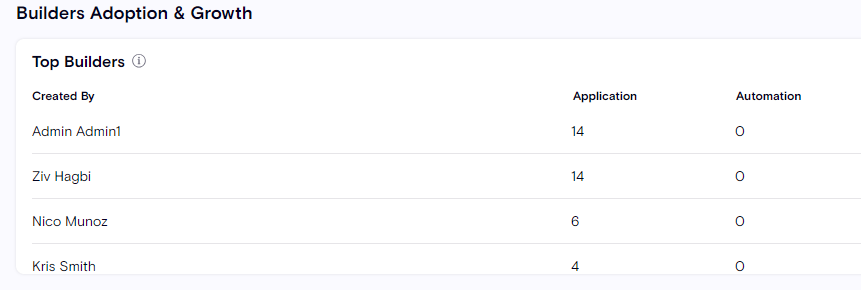
The Top Builders widget will count Reports and stand-alone dashboards (not embedded in an App) only as only they have 'Created by' information recorded in the Power BI Admin API.
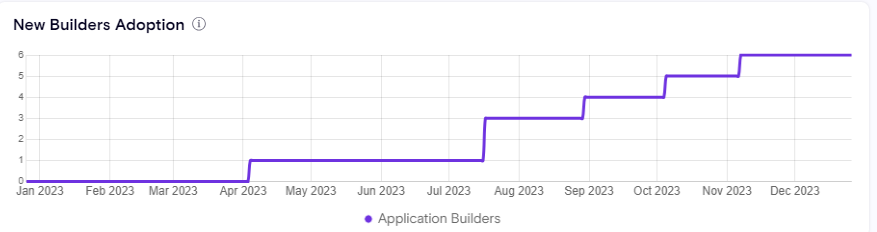
The New Builders Adoption will count Reports only as only reports have the 'Created by' & 'Created at' information recorded in the Power BI Admin API.
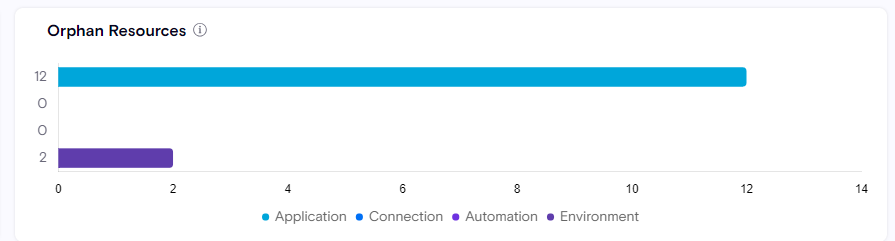
The widgets Orphan Resources will count Reports, Apps and Dashboards (shown under the Application category) and Workspaces (shown under the Environment category)
The widgets Unused Resources will be supported soon.